In the following experiment, we benchmarked JiST running a full SWANS ad hoc wireless network simulation. We measured the performance of simulating an ad hoc network of nodes running a UDP-based beaconing node discovery protocol (NDP) application. Node discovery protocols are an integral component of many ad hoc network protocols and applications [3,4]. Also, this experiment is representative both in terms of both code coverage and network traffic: it utilizes the entire network stack and transmits over every link in the network every few seconds. However, the experiment is still simple enough that we have high confidence of simulating exactly the same operations across the different platforms, SWANS, GloMoSim and ns2, which permits comparison and is difficult to achieve with more complex protocols. Finally, we were also able to validate the simulation results against analytical estimates.
We constructed the following identical scenario in each of the simulation platforms. The application at each node maintains a local neighbor table and beacons every 2 to 5 seconds, chosen from a uniform random distribution. Each wireless node is placed randomly in the network coverage area and moves with random-waypoint mobility [4] at speeds of 2 to 10 meters per second selected at random and with pause times of 30 seconds. Mobility in ns2 was turned off, because the pre-computed trajectories resulted in excessively long configuration times and memory consumption. Each node is equipped with a standard radio configured with typical 802.11b signal strength parameters. We ran simulations with widely varying numbers of nodes, keeping the node density constant, such that each node transmission is received, on average, by 4 to 5 nodes and interferes with approximately 35 others. Above each radio, we constructed a stack of 802.11b MAC, IPv4 network, UDP transport, and NDP application entities.
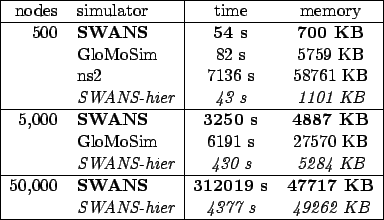
We ran this network model for 15 simulated minutes and measured overall memory and time required for the simulation. For memory, we included the base process memory, the memory overhead for simulation entities, and all the simulation data at the beginning of the simulation. For time, we included the simulation setup time, the event processing overheads, and the application processing time.
The throughput results are plotted both on log-log and linear scales in
Figure 3. As expected, the simulation times are quadratic
functions of ![]() , the number of nodes, when using the naïve signal
propagation algorithm. Even without node mobility, ns2 is highly inefficient.
SWANS outperforms GloMoSim by a factor of 2. SWANS-hier uses the improved
hierarchical binning algorithm to perform signal propagation instead of
scanning through all the radios. As expected, SWANS-hier scales
linearly with the number of nodes.
, the number of nodes, when using the naïve signal
propagation algorithm. Even without node mobility, ns2 is highly inefficient.
SWANS outperforms GloMoSim by a factor of 2. SWANS-hier uses the improved
hierarchical binning algorithm to perform signal propagation instead of
scanning through all the radios. As expected, SWANS-hier scales
linearly with the number of nodes.
The memory footprint results are plotted in Figure 4 on log-log scale. JiST is more efficient than GloMoSim and ns2 by almost an order and two orders of magnitude, respectively. This allows SWANS to simulate much larger networks. The memory overhead of hierarchical binning is asymptotically negligible.
|
Finally, we tested SWANS with some very large networks. We ran the same
simulations on dual-processor 2.2GHz Intel Xeon machines (though only one
processor was used) with 2GB of RAM running Windows 2003. The results are
plotted in Figure 5 on a log-log scale. We show SWANS
both with the naïve propagation algorithm and with hierarchical binning, and
we observe linear behavior for the latter in all simulations up to networks of
one million nodes. The ![]() node simulation consumed just less than 1GB of
memory on initial configuration, ran with an average footprint of 1.2GB
(fluctuating due to delayed garbage collection), and completed within
node simulation consumed just less than 1GB of
memory on initial configuration, ran with an average footprint of 1.2GB
(fluctuating due to delayed garbage collection), and completed within
![]() hours. This exceeds previous ns2 and GloMoSim results by two
orders of magnitude, using only commodity hardware.
hours. This exceeds previous ns2 and GloMoSim results by two
orders of magnitude, using only commodity hardware.
![\includegraphics[width=\columnwidth,keepaspectratio]{include/ndptime_log}](img11.png)
![\includegraphics[width=\columnwidth,keepaspectratio]{include/ndptime_lin}](img12.png)
![\includegraphics[width=\columnwidth,keepaspectratio]{include/ndptimelarge_log}](img15.png)